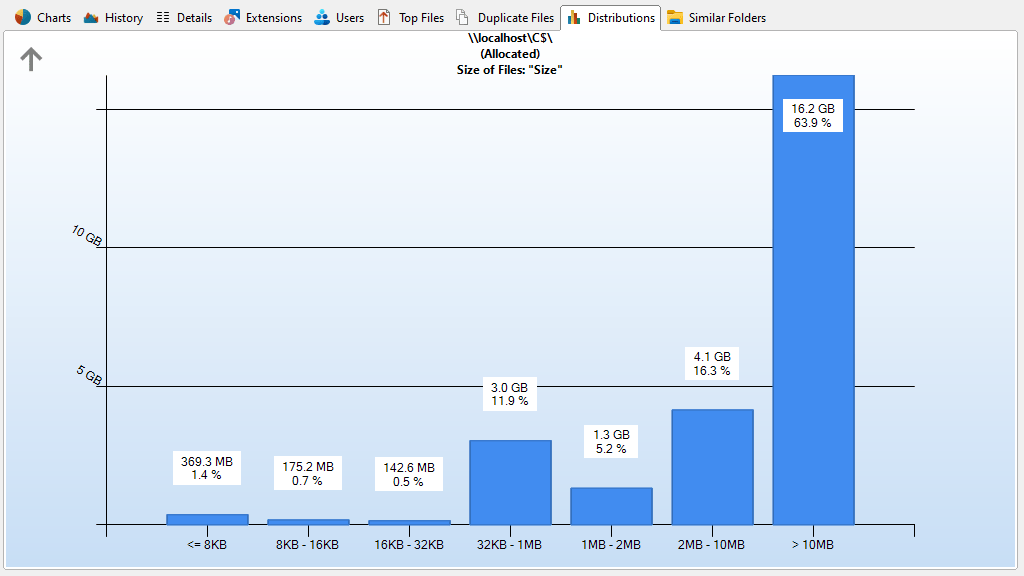
The Distributions view shows the distribution of the age of scanned files or the distribution of the size of the scanned files, based on one of the following file attributes:
The age distribution can be based on:
•Last Access Date
•Last Change Date
•Creation Date
The size distribution can be based on:
•Real Size
•Allocated Space
Values for the specified period do not include the other, younger periods.
Use the "Limit to this Distribution" option from within the context menu to only show sizes of the selected date or size interval in the File System Tree and the Details. Use "Show Files" to list all files of the selected date or size interval.
Note: Within an update scan, the size information shown in the distributions and in the directory tree could differ.
Context tab: Distributions
The Ribbon tab for the "Distributions" view offers export features equal to the Charts tab and enables you to customize the intervals. The boundaries of the intervals are always rounded to full days, i.e. to 00:00 a.m.
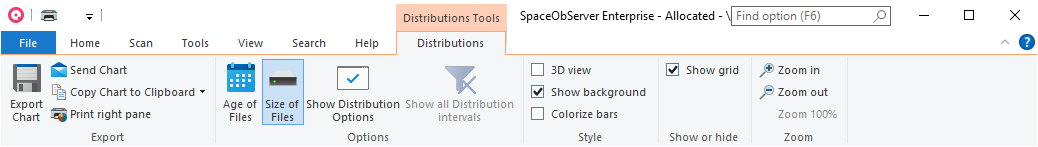
The following commands are available on the "Distributions" tab:
Export Chart |
Saves the current chart as a graphic file. |
Send Chart |
Exports the current chart and send it via email. You can configure your email settings in options dialog. |
Copy Chart to Clipboard |
Copies the current chart to the clipboard (can be pasted in other applications). |
Print right pane |
Prints the current chart. |
Age of Files |
Shows the distribution of the age of scanned files. |
Size of Files |
Shows the distribution of the size of scanned files. |
Show Distribution Options |
Opens the Options dialog of SpaceObServer where you can determine the distribution intervals and other options regarding the file distribution. |
Show all Distribution intervals |
Removes the limitation to a specific distribution interval. |
3D view |
Toggles the 3D and 2D view of the chart. |
Show background |
Toggles the gradient in the background of the chart. |
Colorize bars |
Colorizes the bars of the chart in different colors. |
Show grid |
Shows or hides horizontal and vertical grid lines for this chart. |
Zoom in |
Zooms in the chart. |
Zoom out |
Zooms out of the chart. |
Zoom 100% |
Resets the zoom level to default. |