TreeSize is able to visualize folder information in several different types of charts. The information is based on the currently active view mode of TreeSize. There are three basic types of charts, namely:
Please note: a context tab will be activated when the Chart view is selected. It allows you to manipulate the charts in several ways, for example zooming, turning on or off the grid lines, switching between 2D and 3D mode, changing colors, etc. Using the tab, you can also copy the current chart to the clipboard or save it as a file.
More options to individualize the Charts are available with the Options Dialog.
Some elements are available exclusively for certain types of charts (e.g. "Level of Details" for "treemap " charts only).
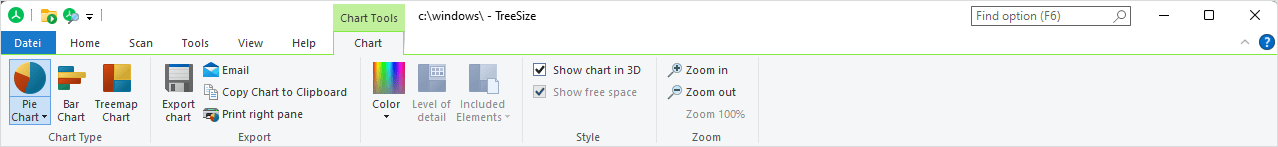
For all directory charts the following commands are commonly available:
Dependent on the displayed chart type, there are additional options available:
For pie charts:
Show Free Space |
Show the free space of a drive as additional slice. |
For bar charts:
Show Grid |
Show or hide grid lines for this chart. |
For the treemap chart:
Level of detail |
Change the detail level of the treemap chart. |
Show Free Space |
Show the free space of a drive as a separate tile. |
Included Elements |
The treemap chart allows you to specify which elements should be included with the chart. The size of each tile represents the size of the according element (usually the summarized size of the contained files), just as for folders. Activating more than one type of elements to be included, a hierarchical structure will be implied: Each file belongs to an extension, each extension belongs to a file type group, and each group belongs to a folder. The legend of the chart will adapt to the selected elements. There are several options available: |
Show single files |
Include a separate tile for each file. |
Show extensions |
Include a separate tile for each extension contained within a folder. |
Show file type groups |
Include a separate tile for each file type group contained within a folder. |
Context Menu
Right-clicking on any chart shows a popup menu offering additional features, such as opening the corresponding item in the Windows Explorer.
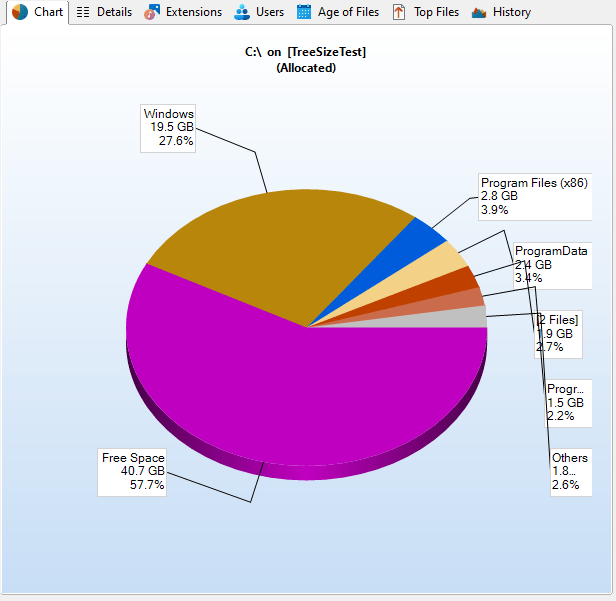
Pie Chart
The Pie Chart shows the relative portions of each subfolder of the currently selected item in the Directory Tree.
The diagram contains the name of each folder, its size (or allocated space, or number of files; for more information please see view modes), and its percentage value. Small folders may be summarized in a slice named "Other".
If a root of any drive is displayed in a pie chart and you have switched to the "Allocated Space" mode, the free space of this drive will also be displayed as one slice of the pie. This behaviour can be switched on or off in the options menu. The pie chart shows the free space as one slice among the others and calculates the percentage appropriately (relatively to the others), so the percent value might differ from the "% Free" value of the drive if TreeSize didn't see all files.
Hovering over a slice will show detailed information about the corresponding folder, double clicking will change into the selected folder.
Double-clicking on a slice will show the pie chart view for the selected folder. In case the clicked slice represents a file, it would be executed. Right click a slice in order to perform file operations like delete, copy, paste, properties etc. To manage several folders at once hold the shift key while selecting the desired segments in chart.
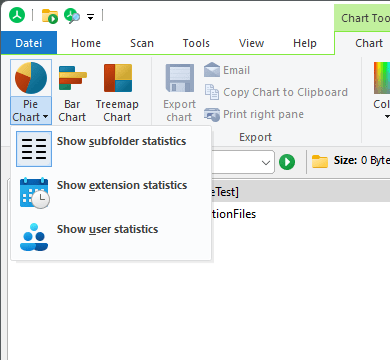
Please note that the Pie Chart not only visualizes the sizes of each subfolder of the currently selected item in the Directory Tree, but also the distribution of file extensions and even the file and directory owners (user statistics). To change the type of the Pie Chart, please click on the drop-down arrow right beside the caption of the Ribbon button (see image below).
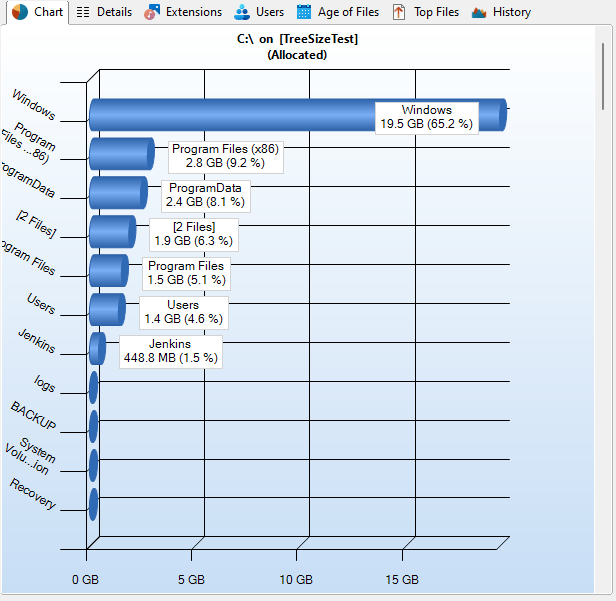
Bar Chart
The Bar Chart visualizes folder sizes in form of horizontal bars. Grid lines in the background of the chart allow for easy determination of folder sizes and comparison of each folder in relation to other folders on the same directory level. As with the pie chart, hovering over a bar will call up more detailed information about the corresponding folder. Double-clicking on a bar will show the bar chart view for the selected folder.
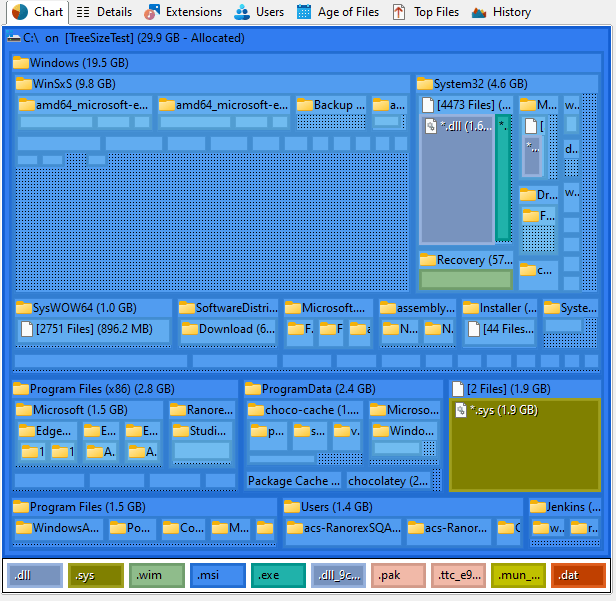
Treemap Chart
The treemap chart is a hierarchical chart that is able to visualize the sizes of each subfolder (not only direct child folders) of a selected directory branch.
Each folder is shown as a rectangle. The area of the rectangle represents the size of the corresponding folder. The rectangles of subfolders are located inside the rectangle of their parent folder. If a folder has no subfolders and the file extensions statistics was activated during the scan, the file types are now shown as subitems.
The color of the rectangle face indicates the directory level. The colors range from a darker blue (top level directories) to a lighter blue (directories with a deep file system level). These colors can be adjusted using the color picker in the context tab. The context menu of the treemap chart also allows you to apply a predefined color scheme. The shown rectangles must have a minimum size to be displayed. You can customize this minimum value using the Level of Detail track bar in the context tab. If this value is small, the chart might look very complex and confusing.
If you place the mouse cursor over the chart, you will see a tooltip containing information about the directory the cursor hovers over. Double-clicking on one of the rectangles will navigate to the corresponding directory in the Directory Tree. Drag and drop operations are supported in the treemap chart.