

Visualize Scan Results
Keeping track of storage space usage on your storage with TreeSize is really easy, thanks to its ability to visualize scan results. TreeSize provides graphical insight into how and where your hard disk, NAS or server space is being used - locally as well as across your network.
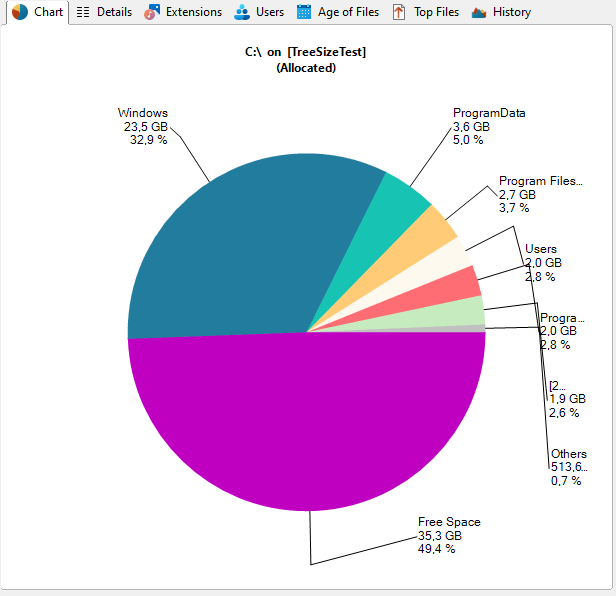
In the pie chart, you can see the relative proportions of each subfolder of the currently selected item in the directory tree. Hover over a slice to see detailed information, double click it to change into the selected folder.
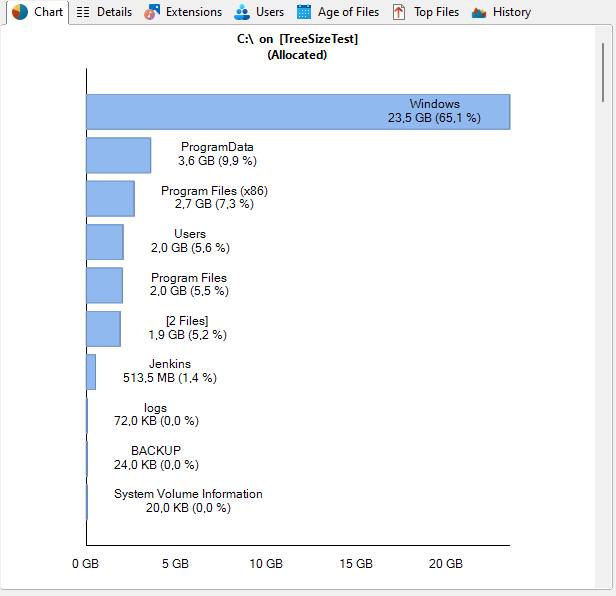
Use the bar chart to visualize used space in form of horizontal bars, instead.
Visualize hierarchies and sizes of subfolders
In the hierarchical treemap chart, the size of the tiles mirrors the size of the directories they represent. Each folder-tile contains tiles symbolizing subfolders, file types, or files.
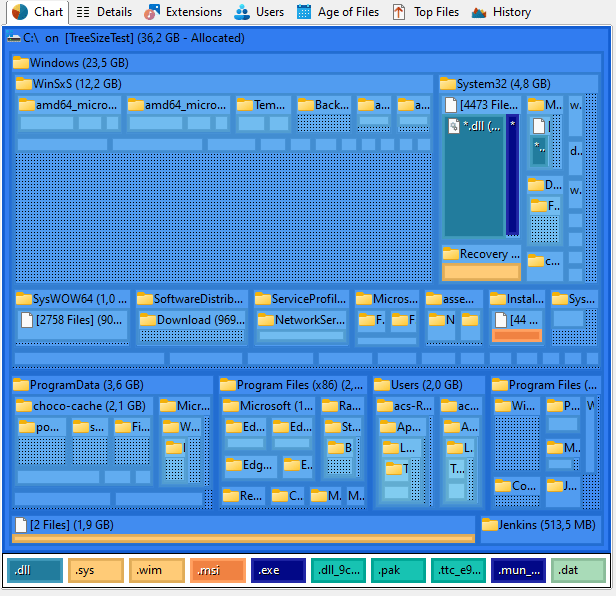
Choose your favorite among a range of options:
- Adjust the level of detail of the information that is shown in the tree map using a slider.
- Customize whether or not files and file types are shown in the tree map
- Modify the colors of the treemap chart to fit your preferences.
- Choose between a flat 2D view and a 3D view that shows the tiles like a cushion.
The TreeSize treemap chart supports Drag&Drop operations.
This is just one among a range of several graphical viewing options that TreeSize offers.