

SpaceObServer Visual Tour
Find out more about SpaceObServer with our visual tour!
Main Program
Main Window
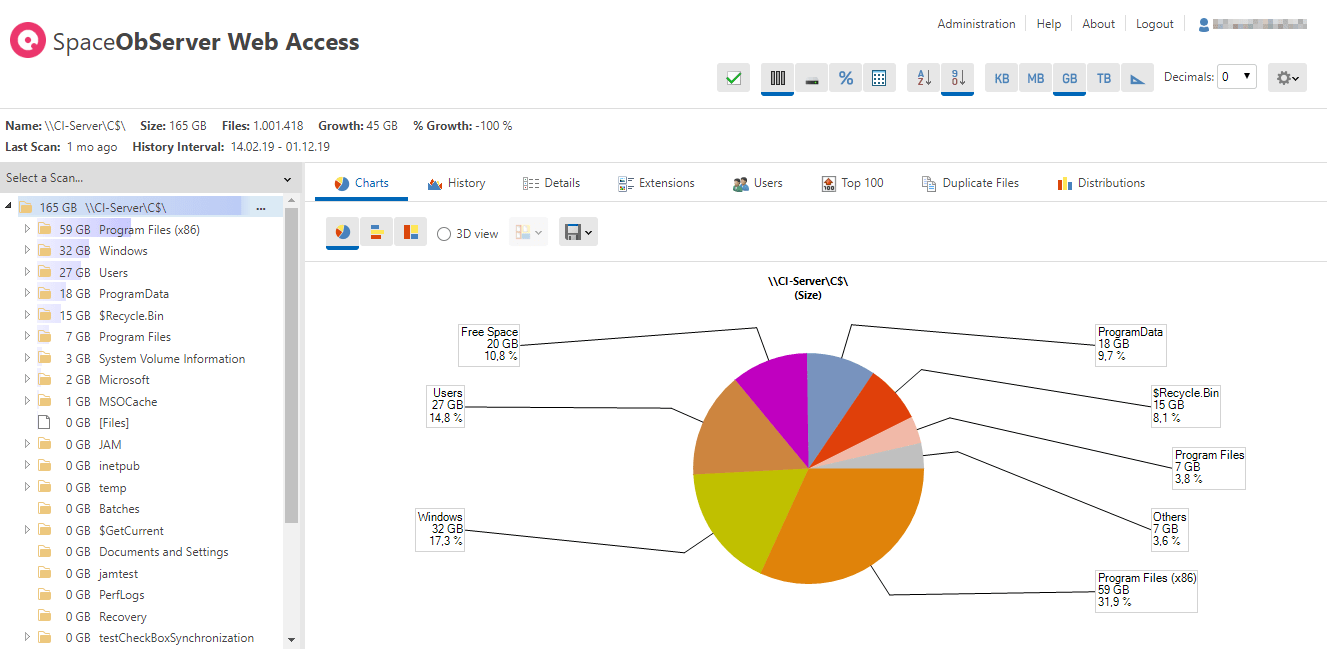
In the main window you will find a tree view of all accessible scanned folders (left) as well as detailed information regarding the selected tree elements (right).
Pie Chart
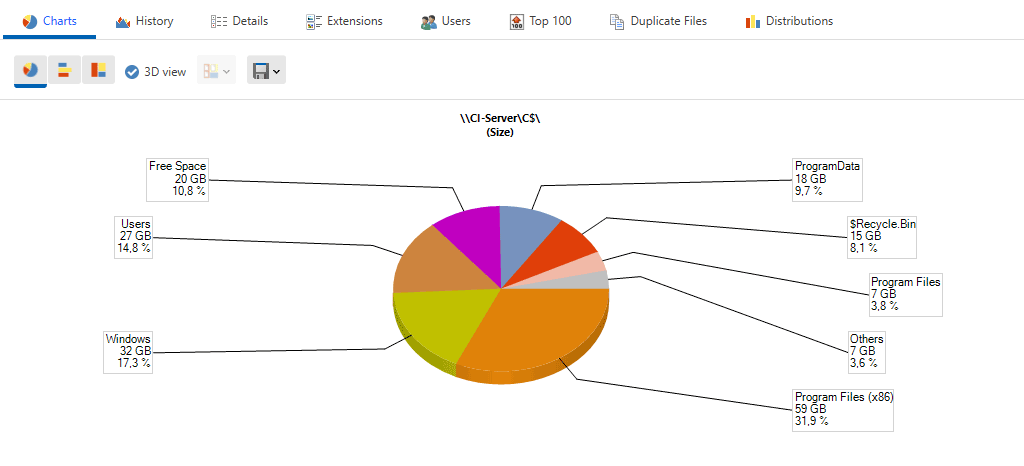
The pie chart visualizes the allocation of disk space. Users can switch between 2D and 3D view.
Bar Chart
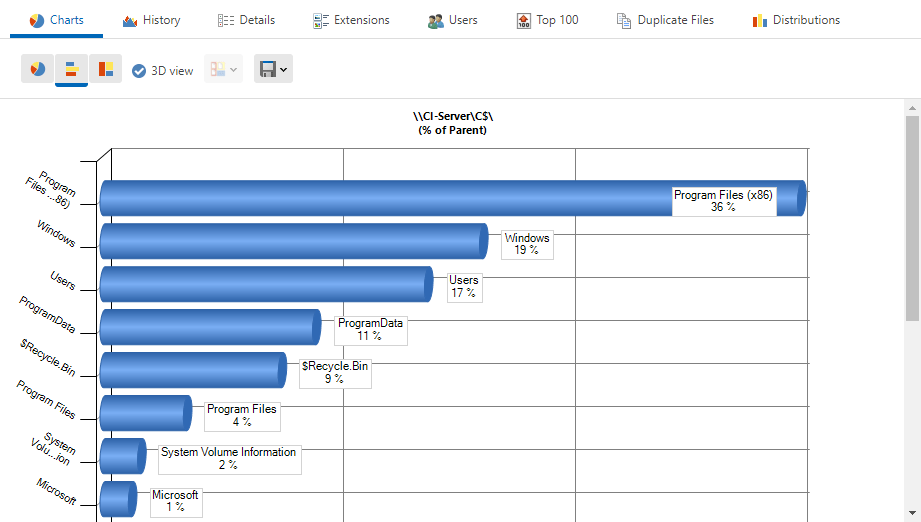
An alternative graphical presentation to quickly get good insights of the disk usage is the bar chart.
History
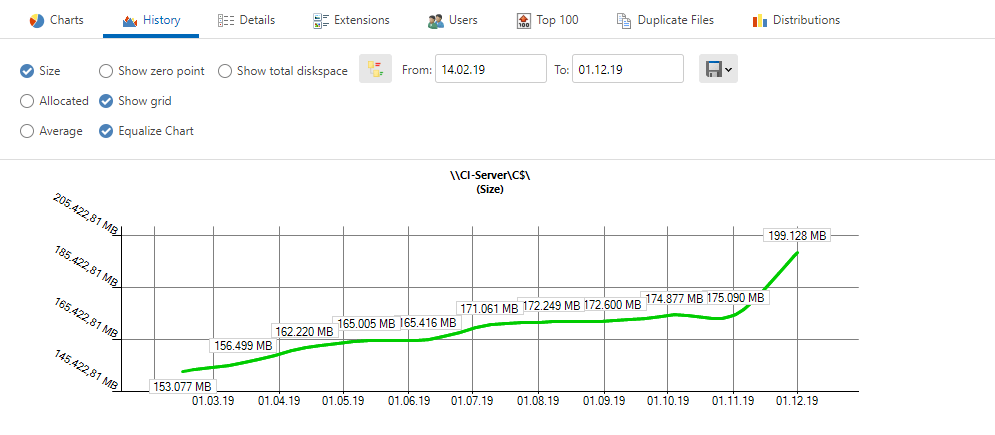
The history chart presents the development of disk space usage over time. Increases and decreases in size can be shown for each subfolder separately - simply select a folder in the left window.
Details View
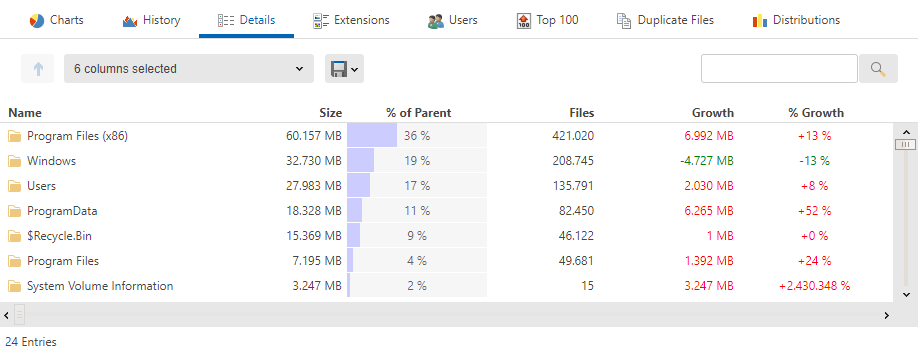
Select the details view to find information regarding files and folders, such as
- size
- occupied disk space
- allocated disk space in parent folder (%)
- number of files
File Extensions
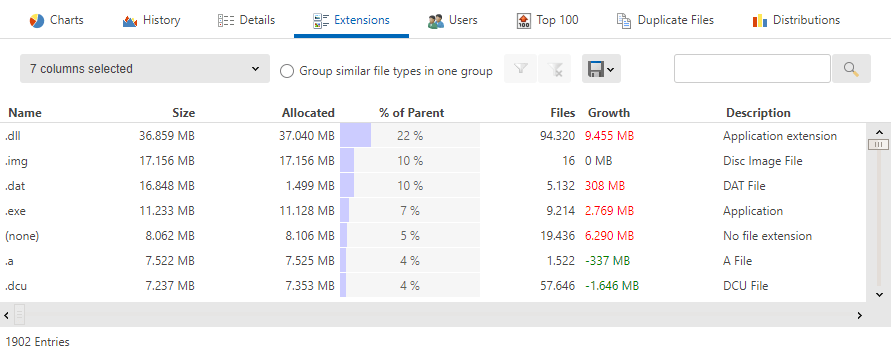
The extensions view groups disk space usage according to file types.
Users
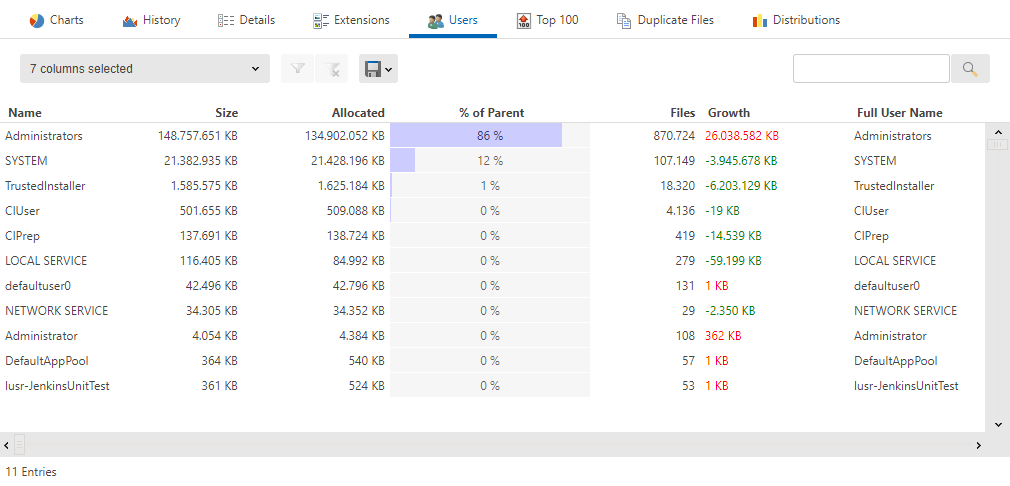
The users view provides insight into the disk space usage per user.
Top 100 Files
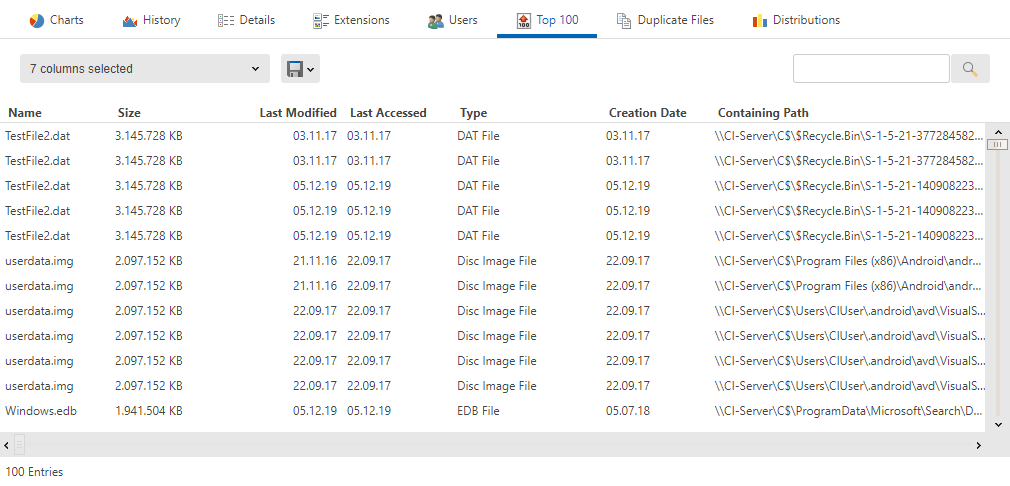
The Top 100 view shows the 100 largest files in a scanned folder or on a scanned disk. It comes in handy if disk space runs low and users want to clean up disk space fast.
Checkboxes
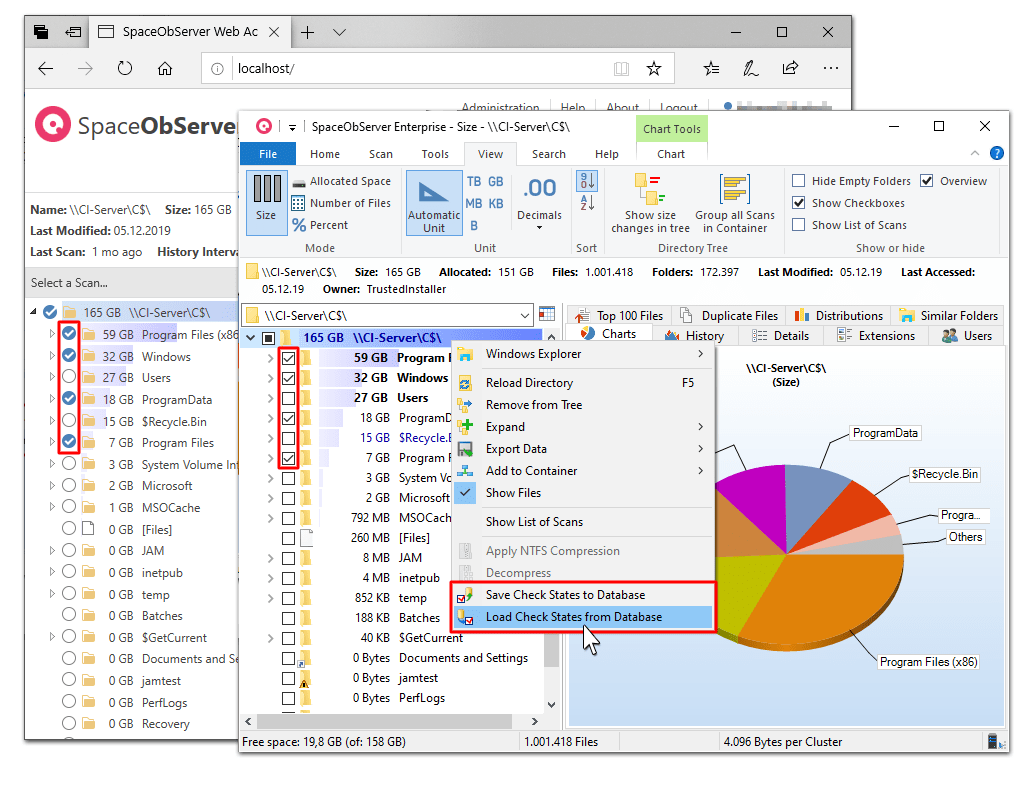
Users can check or uncheck single folders and/or their subfolders in the Web Access Interface. Admins can access each user's checkstates and save them to/load them from the database. This way, users can, for instance, mark folders to be moved or archived.
Duplicate Files
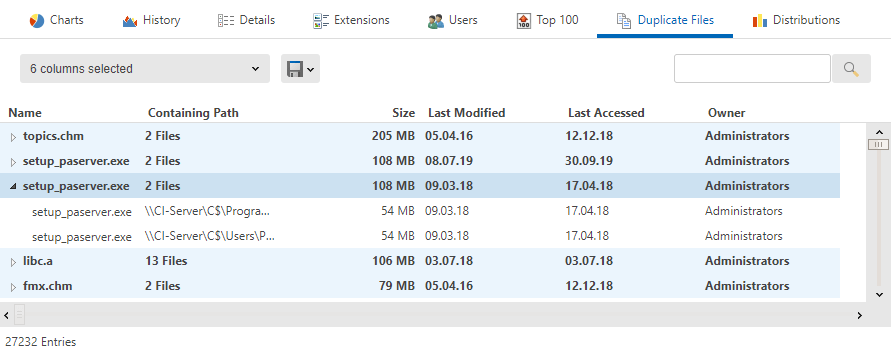
See duplicate files and reclaim server space by deduplicating them.
Functionality of the Add-On
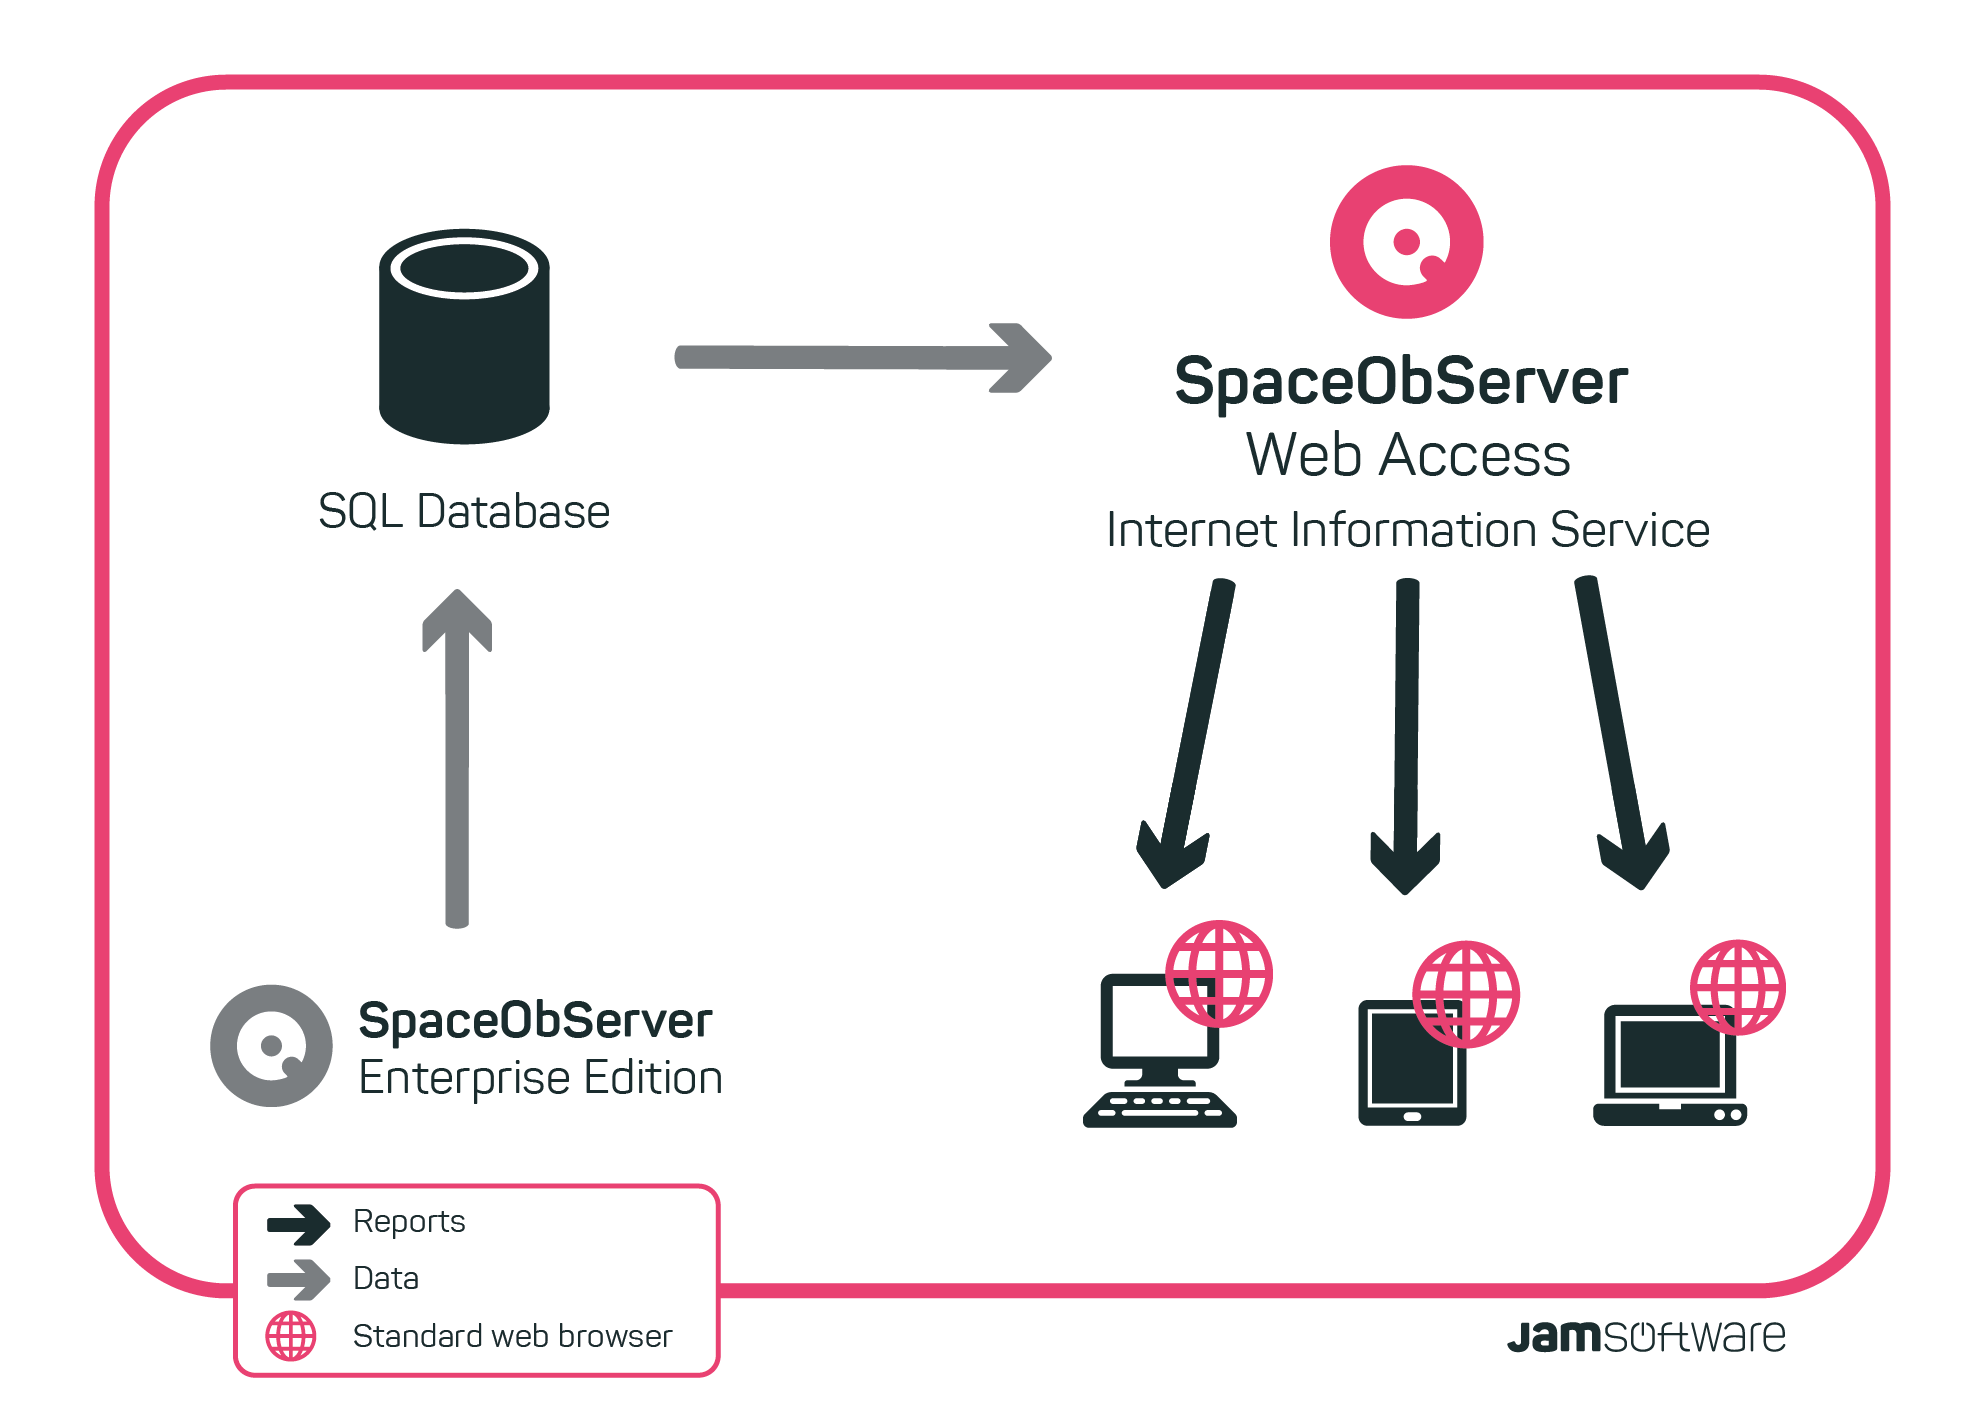
The SpaceObServer Web Access grants remote access to scans created by the SpaceObServer Enterprise Edition: the Web Access connects to the SQL database and receives scan data. It processes the data into clear tables and diagrams. End users open the SpaceObServer URL in their web browser and log in with their Windows accounts (Active Directory). The Web Access is hosted via the Internet Information System (setup configures it automatically). Logged in users can only access reports for which they have permissions.